Stop Firefighting. Start Flowing.
Manufacturing problems aren't random. They're symptoms of systems that were never designed to work together. We fix the system so you stop fighting the same fires every day.
Symptoms We See Every Day
These problems feel unique to your operation, but they're not. They're predictable outcomes of systems that lack stability, visibility, and designed flow.
Firefighting
Every day brings new crises. Your best people spend their time reacting instead of improving. Problems get fixed temporarily, then return.
Bottlenecks
Work piles up in the same places. Some resources are overloaded while others wait. You can't seem to break through the constraint.
People Dependency
Knowledge lives in people's heads, not systems. When key staff are absent, everything slows down. You can't scale what you can't transfer.
Poor Visibility
You find out about problems too late. Data arrives after decisions are made. You're managing by gut feel, not information.
Our Approach
We follow a disciplined sequence. Automation comes last, not first. Each phase builds on the previous, ensuring that improvements stick.
Stabilise & See
Create the foundation
Before we change anything, we make the current state visible. We identify variation, establish baselines, and create the feedback loops that let you see what's actually happening.
Fix the System
Address root causes
With visibility in place, we stabilise and redesign the system. We reduce complexity, eliminate handoff failures, and build processes that work consistently without heroes.
Lock In & Scale
Automation that earns its place
Only now do we automate. Automation amplifies what's already working. We lock in the gains, reduce manual intervention, and create systems that sustain themselves.
Why this sequence matters: Automating an unstable process just creates faster chaos. We stabilise first so automation amplifies performance, not problems.
Our Engagement Flow
A structured approach from diagnosis to results. We move systematically through each phase to ensure stability and lasting improvement.
Diagnose
Identify Problems
Design Improvements
Implement
Deliver Dashboards
Diagnose
Identify Problems
Design Improvements
Implement
Deliver Dashboards
Ready to Fix Your System?
Start with a diagnostic to understand your current state, or explore our system profiles to see which one describes your operation.
Real-Time Shop Floor Visibility for Better Decisions
Automated, trusted production data: captured at the source, displayed live, and stored for analysis. Manufacturing companies use dashboards to monitor availability, performance, and quality (OEE) in real time to improve efficiency and reduce downtime.
How the System Works
Data Collection
Flowstate Systems connects directly to the factory floor to capture production data automatically. Automated machine data removes manual reporting and provides accurate, real-time production data.
- Sensors connected to machines: cycle signals, machine state, and counters
- PLC integration and machine interfaces for direct data access
- Operator input tablets for downtime reasons and quality checks
- Barcode scanning for job tracking and traceability
- Integration with existing ERP and MES systems
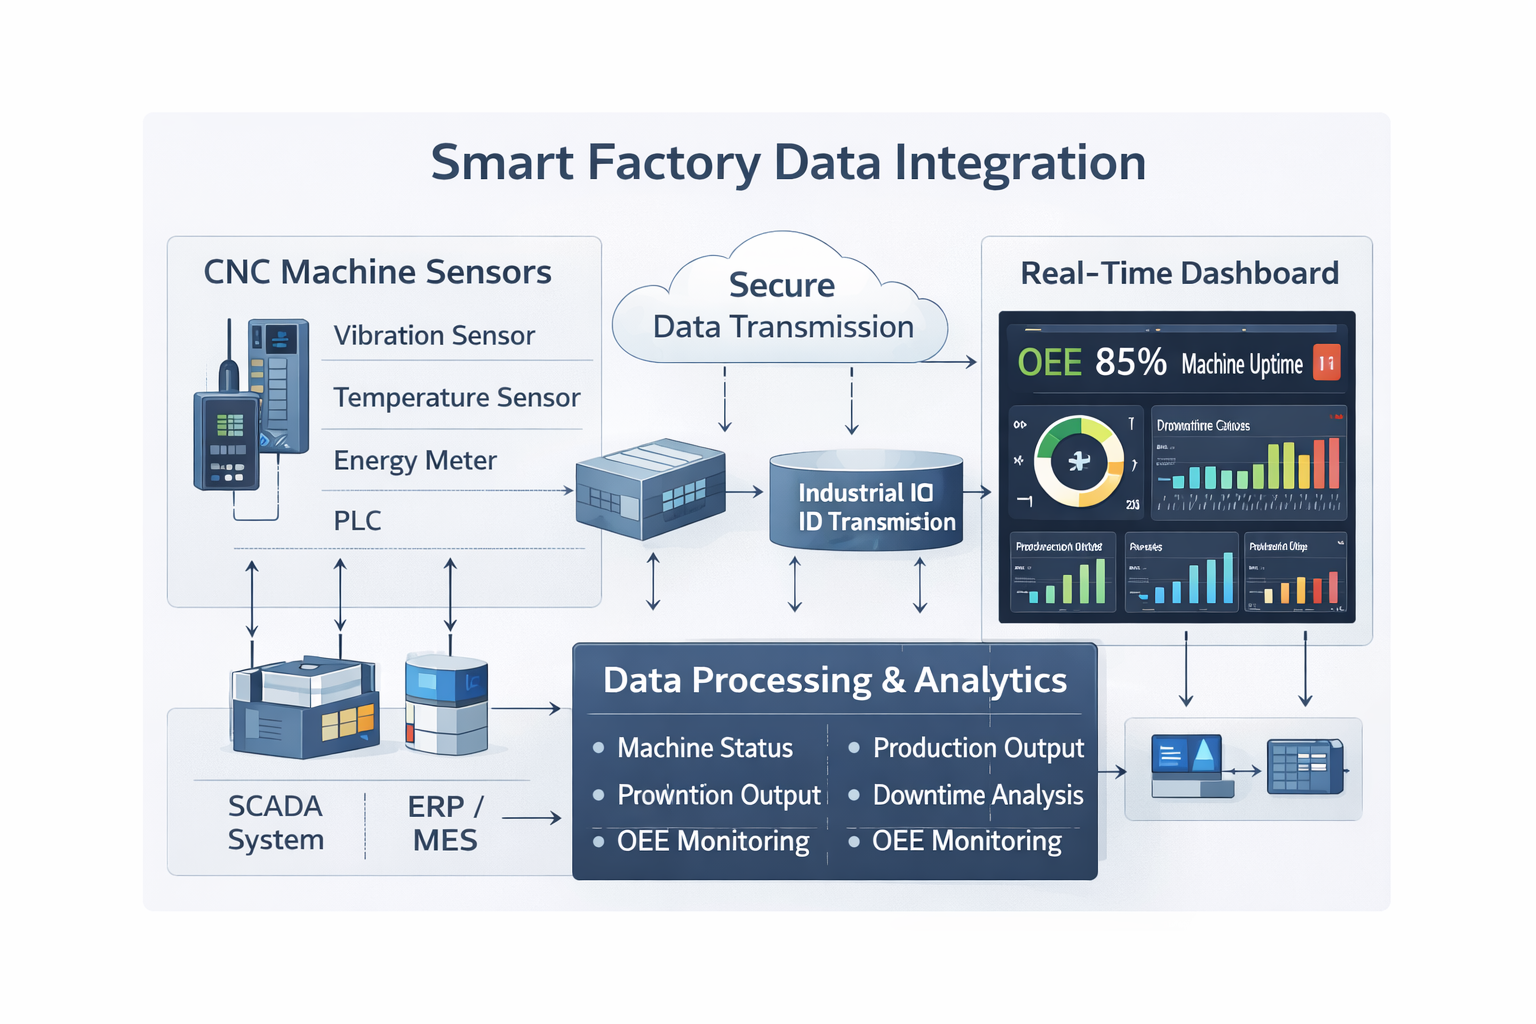
CNC machine sensors, vibration monitors, PLCs, and SCADA systems feeding industrial data collection gateways.
Edge Gateways
Low-latency data collection at the machine level
Secure Storage
Cloud or on-premise database with redundancy
Data Normalisation
Unified schema across machine types and protocols
ERP Integration
Production schedules and job data linked automatically
Real-Time Pipelines
Live data streams for dashboards and alerting
Data Processing & Integration
Collected data is transformed into usable intelligence through secure processing pipelines. Raw machine signals become structured, validated datasets ready for analysis and decision-making.
The system normalises data across different machine types and protocols, integrates with existing ERP systems, and maintains real-time data pipelines that feed directly into live dashboards and automated alerts.
Digital Dashboards & Insights
Real-time dashboards provide operational intelligence that enables data-driven continuous improvement. Leadership sees what matters. Operators see what to act on. Engineers see where to investigate.
Dashboards are designed for the people who use them. Not just management reports. Each view is tailored to a role, from shift operators to plant managers, delivering the right data at the right level.
OEE dashboards
Availability, performance, and quality tracked in real time
Uptime & downtime tracking
Machine-level visibility with automatic logging
Production vs target
Shift-by-shift output monitoring against plan
Quality defect tracking
Reject rates and quality trend analysis
Maintenance alerts
Performance trends and predictive maintenance signals
Reduced Downtime
Identify and address stoppage causes with real data instead of guesswork.
Improved Throughput
Track production against targets and eliminate bottlenecks systematically.
Continuous Improvement
Data-driven root cause analysis and evidence packs for improvement meetings.
What You Get
Live operational dashboard
Production, downtime, and status in real time
Automated reporting
Daily and weekly summaries delivered automatically
Downtime Pareto & loss breakdowns
Clear visibility of where losses occur
Evidence packs for root cause
Data-backed support for improvement meetings
Clean data store
Ready for future analytics and automation
You own your data. The system is designed to remain usable and maintainable after handover.